Everything on the Fed, in one place
Six surfaces built on the same historical communication record. Each one shows you what happened and what changed — never what to trade.

Statement diff engine
The moment a statement drops, we diff it against the previous one and highlight every wording change — additions, deletions, and the subtle hedges that move a meeting. No hunting through PDFs.
- Paragraphs are aligned structurally before the word-level diff runs, so a moved sentence reads as moved — not as a delete plus an insert.
- Every change carries a materiality weight: the rate-guidance paragraph counts 1.0, economic conditions 0.7, boilerplate 0.1. Material changes (≥ 0.4) get the badge.
- The diff against the prior statement is prepared before the release window opens, so on decision day only the new text stands between release and your screen.
Historical playbooks
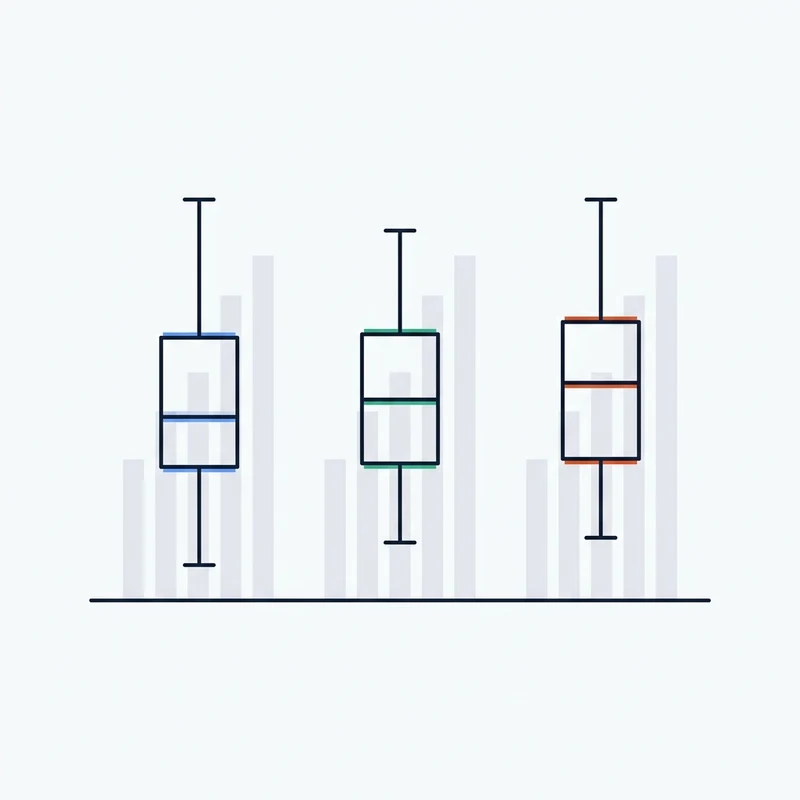
For a given change in language, see how markets moved across every past occurrence — median and interquartile range across instruments, with the underlying instances behind the number. Patterns with fewer than three occurrences are marked as insufficient history rather than dressed up as a signal.
- Each language pattern maps to every past statement that carried it, joined to how markets moved in the 5-minute, 1-hour, close, and next-day windows.
- You get the median and interquartile range per window — and every underlying instance, because a median without its instances is not evidence.
- The occurrence count n is always shown. Below three occurrences we withhold the medians and show only the instances, labelled insufficient history.

Whisperer alerts
We watch the reporters the desk reads for Fed guidance and alert you the moment a tracked byline publishes — headline, snippet, and link, delivered as it lands so you are not the last to see it.
- During each blackout window — the ten days before a decision through the decision itself — tracked bylines are polled every 30 seconds; every 5 minutes otherwise.
- Each alert arrives with the headline, a short snippet, a dovish-to-hawkish tone reading, and a link out to the article. We never republish body text.
- Delivery latency is instrumented as a first-class metric against a sub-60-second target.

Divergence gauge
One reading of the gap between what the market has priced for rates and the Fed's published projection path. See where they agree, where they diverge, and how that spread has moved over time.
- The market path comes from futures-implied rates; the Fed path is interpolated from the latest SEP median dots. The gauge is the average gap over the next four quarters.
- A negative reading means the market has priced more cuts than the Fed projects — the sign and the spread are always shown together.
- Recomputed daily at 16:30 New York time, and intraday on event days. Each reading carries its percentile against ten years of the same computation.
Live tone scoring
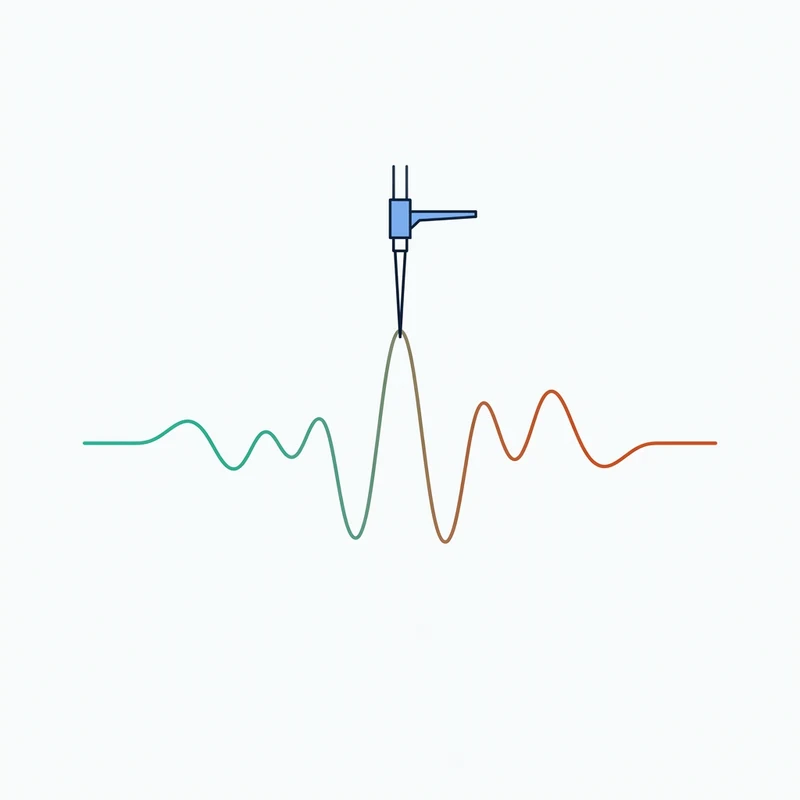
During a press conference or statement release, our tone meter scores the language dovish-to-hawkish in real time, sentence by sentence. Reconnect-safe, so the live screen resumes rather than going blank if your connection drops.
- Every sentence is scored on a −100 to +100 dovish–hawkish scale as it lands; the document score is the length-weighted mean.
- Scores are calibrated per speaker against a rolling baseline of recent appearances — a shift only flags when it is statistically notable for that speaker (|z| ≥ 1.5), not just off-zero.
- Every score records the method that produced it. Scoring methods are versioned and old scores are never overwritten, so the record stays auditable.

Exposure & scenarios
Add your positions — encrypted, never logged — and see their estimated sensitivity to a rate decision. Model your own meeting scenarios and read the estimated impact across the book. Estimated sensitivity from historical data, not a forecast of profit.
- Sensitivities come from empirical betas — median historical moves per 25 bp of policy surprise, estimated from the reaction record and published on the methodology page. A transparent model, not a black box.
- Define up to six scenarios per meeting with probabilities that sum to one; read the per-scenario and probability-weighted estimated sensitivity across the book.
- Positions are encrypted at the column level, never written to logs, and removed with your account. Everything is labelled estimated sensitivity — a historical reading, not a promise about outcomes.